Manipulate average wage figures to underestimate poverty and adjust statistics to fit Putin’s ‘May decrees’? That seems to be exactly what Rosstat and the authorities in North-West Russia are doing.

Chronicles.Media presents its annual analysis of average salaries in the North-West Federal District (NWFD).
How was it calculated?
For this study, Chronicles used Rosstat data and regional budget data from NWFD subjects. First, we obtained the number of people employed in each region in 2024 and subtracted those considered “informally employed.” According to Rosstat, informal workers include individual entrepreneurs and their employees, self-employed persons without legal registration, and those working in their own households.
How much did these people earn in total?
This is where personal income tax (PIT) becomes useful — it is paid in full to regional and local budgets. These figures are available in official reports on the execution of consolidated regional budgets for 2024.
A consolidated budget, according to the Russian Budget Code, aggregates all local budgets within a region to show total revenue and expenditure.
We excluded PIT received from individual entrepreneurs, lawyers, and the self-employed, as well as tax collected on income from bank deposits, company profits, lottery winnings, and other non-wage sources — all of which are irrelevant to average salary figures.
But we included PIT:
- paid by tax agents — i.e. employers — on behalf of most Russian workers;
- from foreign workers employed under a patent;
- on incomes exceeding 5 million rubles (which are taxed at 15% rather than 13%).
By comparing the amount of PIT collected with the number of officially employed people, we calculated the average wage in each region. If Rosstat doesn’t manipulate its data, our results should match official statistics — allowing for a 2–3% margin of error due to tax arrears, accounting discrepancies, or other unforeseen factors.
Eloquent anomalies
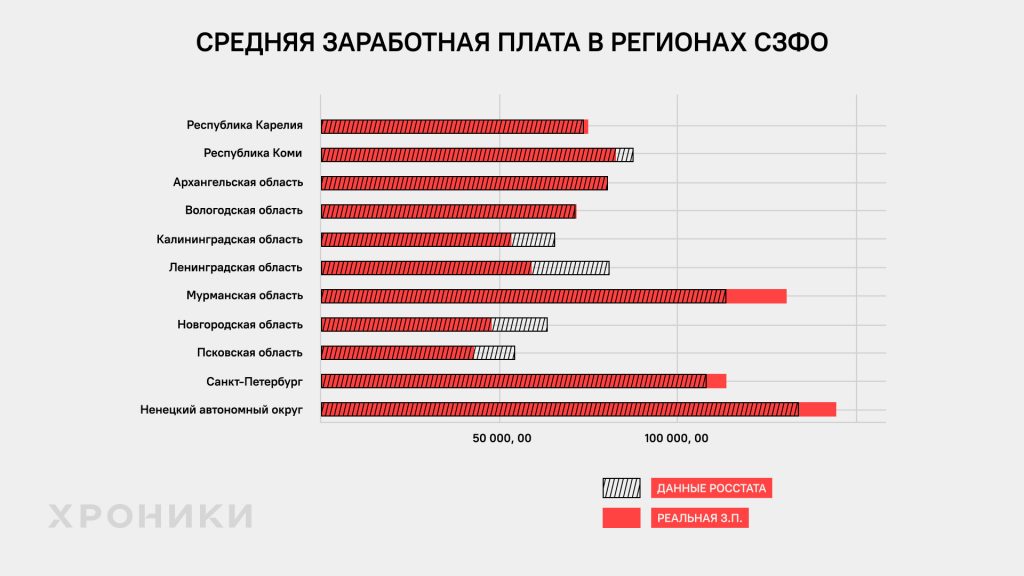
Only Karelia, Arkhangelsk, and Vologda oblasts fell within this acceptable margin of error. In fact, in Karelia, the average salary based on collected tax data was 2% higher than Rosstat’s figure (75.3 vs. 73.8 thousand rubles). In Arkhangelsk and Vologda oblasts, Rosstat’s numbers closely matched the budget-based calculations: 80.7 vs. 80.8 and 71.5 vs. 71.9 thousand rubles, respectively.
Interestingly, in 2023 neither Karelia nor Vologda showed such alignment, but Arkhangelsk has now stood out for the second year in a row — at least in terms of honest wage statistics.
Where statistics serve the narrative
In five out of eleven regions in the North-West Federal District, the actual average salary — calculated from personal income tax revenues — turned out to be much lower than Rosstat’s reported figures. In the Leningrad and Novgorod regions, the difference was especially stark — nearly one-third.
- Leningrad Region: 59,400 rubles (real) vs. 81,000 rubles (Rosstat)
- Novgorod Region: 47,800 rubles vs. 63,900 rubles
Significant gaps were also found in:
- Pskov Region: 43,000 vs. 54,800 rubles
- Kaliningrad Region: 53,500 vs. 65,700 rubles
- Komi Republic: 83,100 vs. 87,600 rubles
There is an explanation for this: by inflating average salary figures, the official poverty rate looks lower. This practice was described in detail back in 2020 in a paper titled “Directions of Social Policy for Supporting Economic Growth in Russia,” published by the Institute of National Economic Forecasting in the journal Problems of Forecasting.
The manipulation is also linked to Putin’s 2012 ‘May Decrees’, which require the state to reduce poverty and raise public sector wages. These targets are politically significant, and as multiple media reports have noted, officials may adjust statistics to demonstrate compliance.
When reality exceeds the fiction
Interestingly, in three regions — St. Petersburg, Murmansk, and the Nenets Autonomous Okrug (NAO) — the opposite trend was observed: tax-based calculations showed higher salaries than those published by Rosstat.
- St. Petersburg: 113,600 rubles (real) vs. 108,300 (Rosstat)
- NAO: 144,300 vs. 134,400 rubles
- Murmansk Region: 130,600 vs. 113,600 rubles
This anomaly has been consistent in Murmansk since Chronicles began monitoring in 2021. It was observed in NAO in 2022 and in St. Petersburg starting in 2021.
But even where average wages appear higher, this doesn’t always translate into fair pay for public sector employees. According to the same ‘May Decrees,’ teachers, nurses, and other public servants should earn no less than the average regional salary, while doctors, researchers, and university faculty should earn at least double that amount.
As Chronicles.Media has previously reported, not a single region in the North-West Federal District has met these targets since 2012. And if Rosstat understates real average wages, it allows regions to legally pay educators and doctors even less — quietly saving budget funds on one of the main voter bases of the ruling party.